-
1
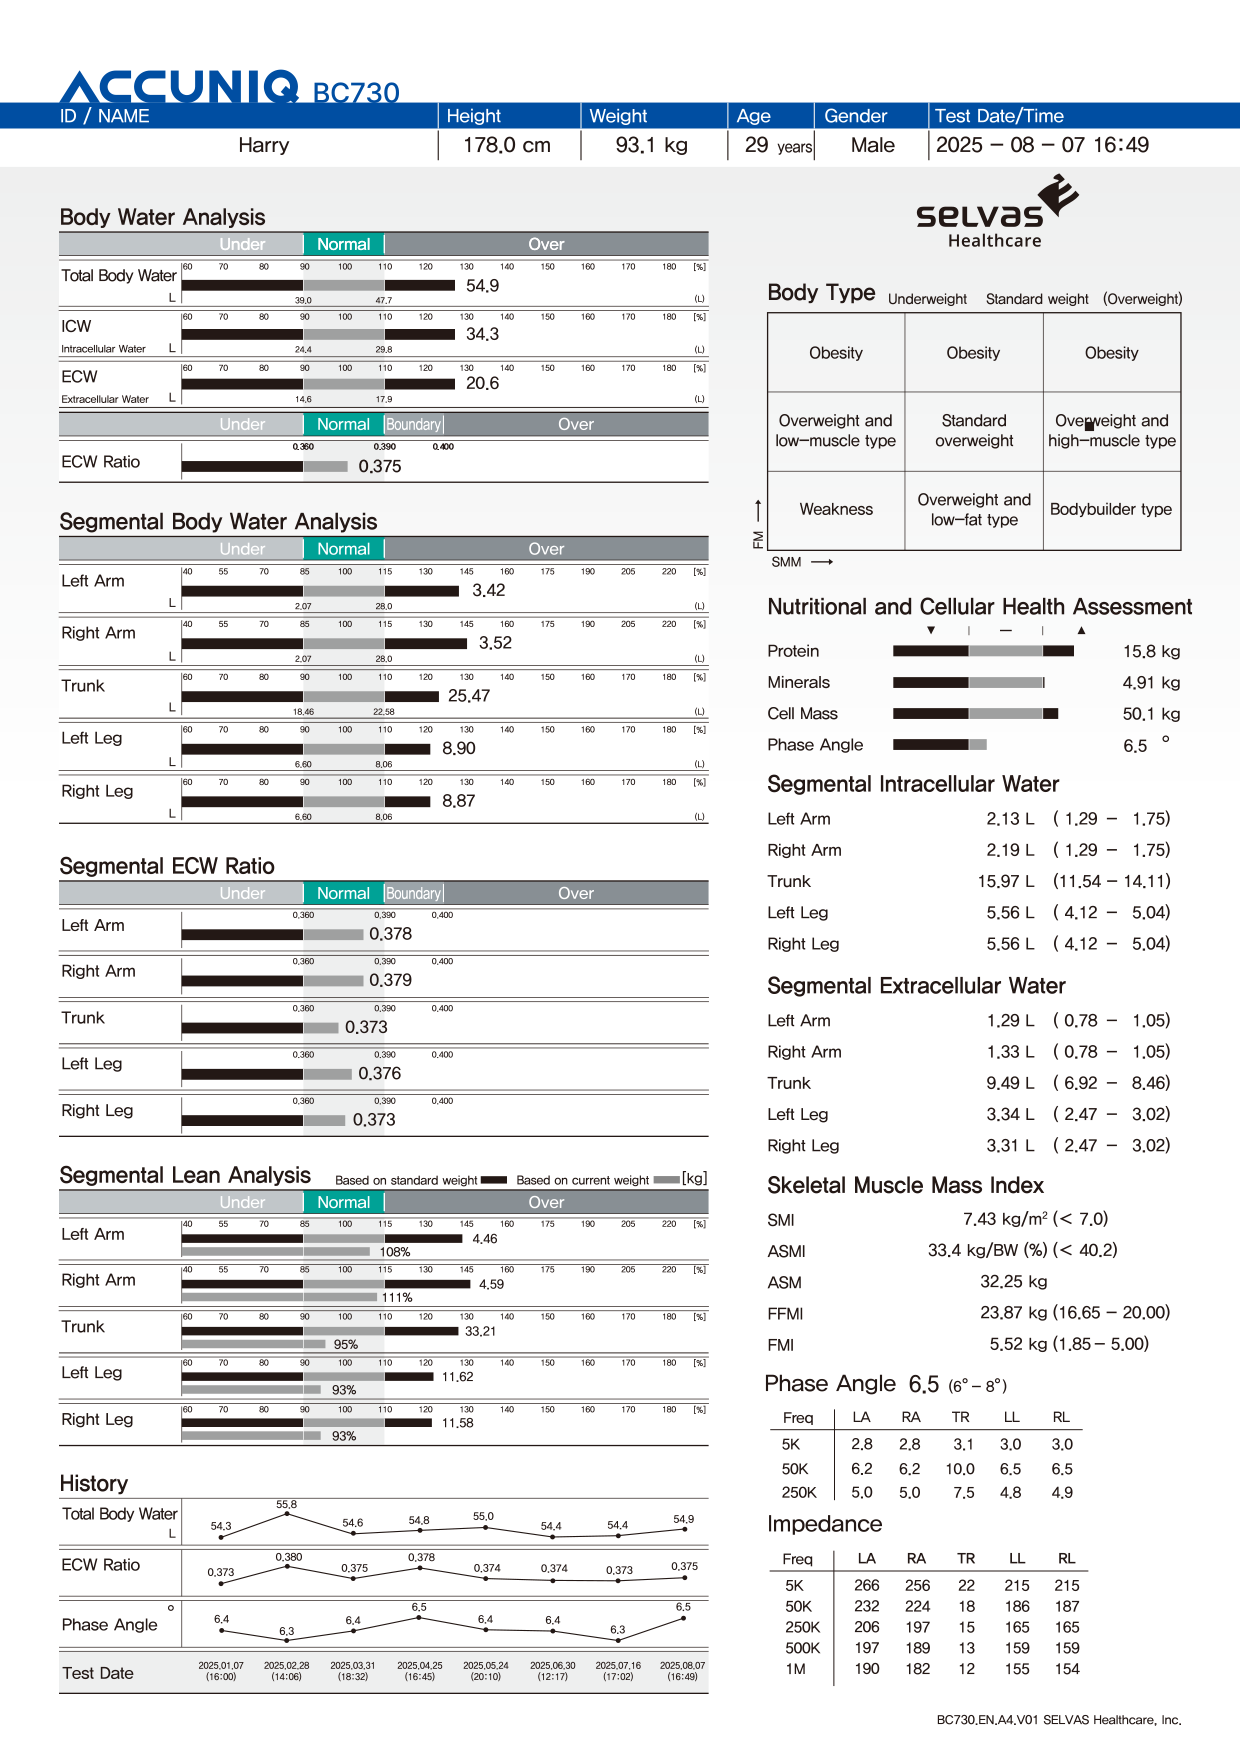
Body Water Analysis
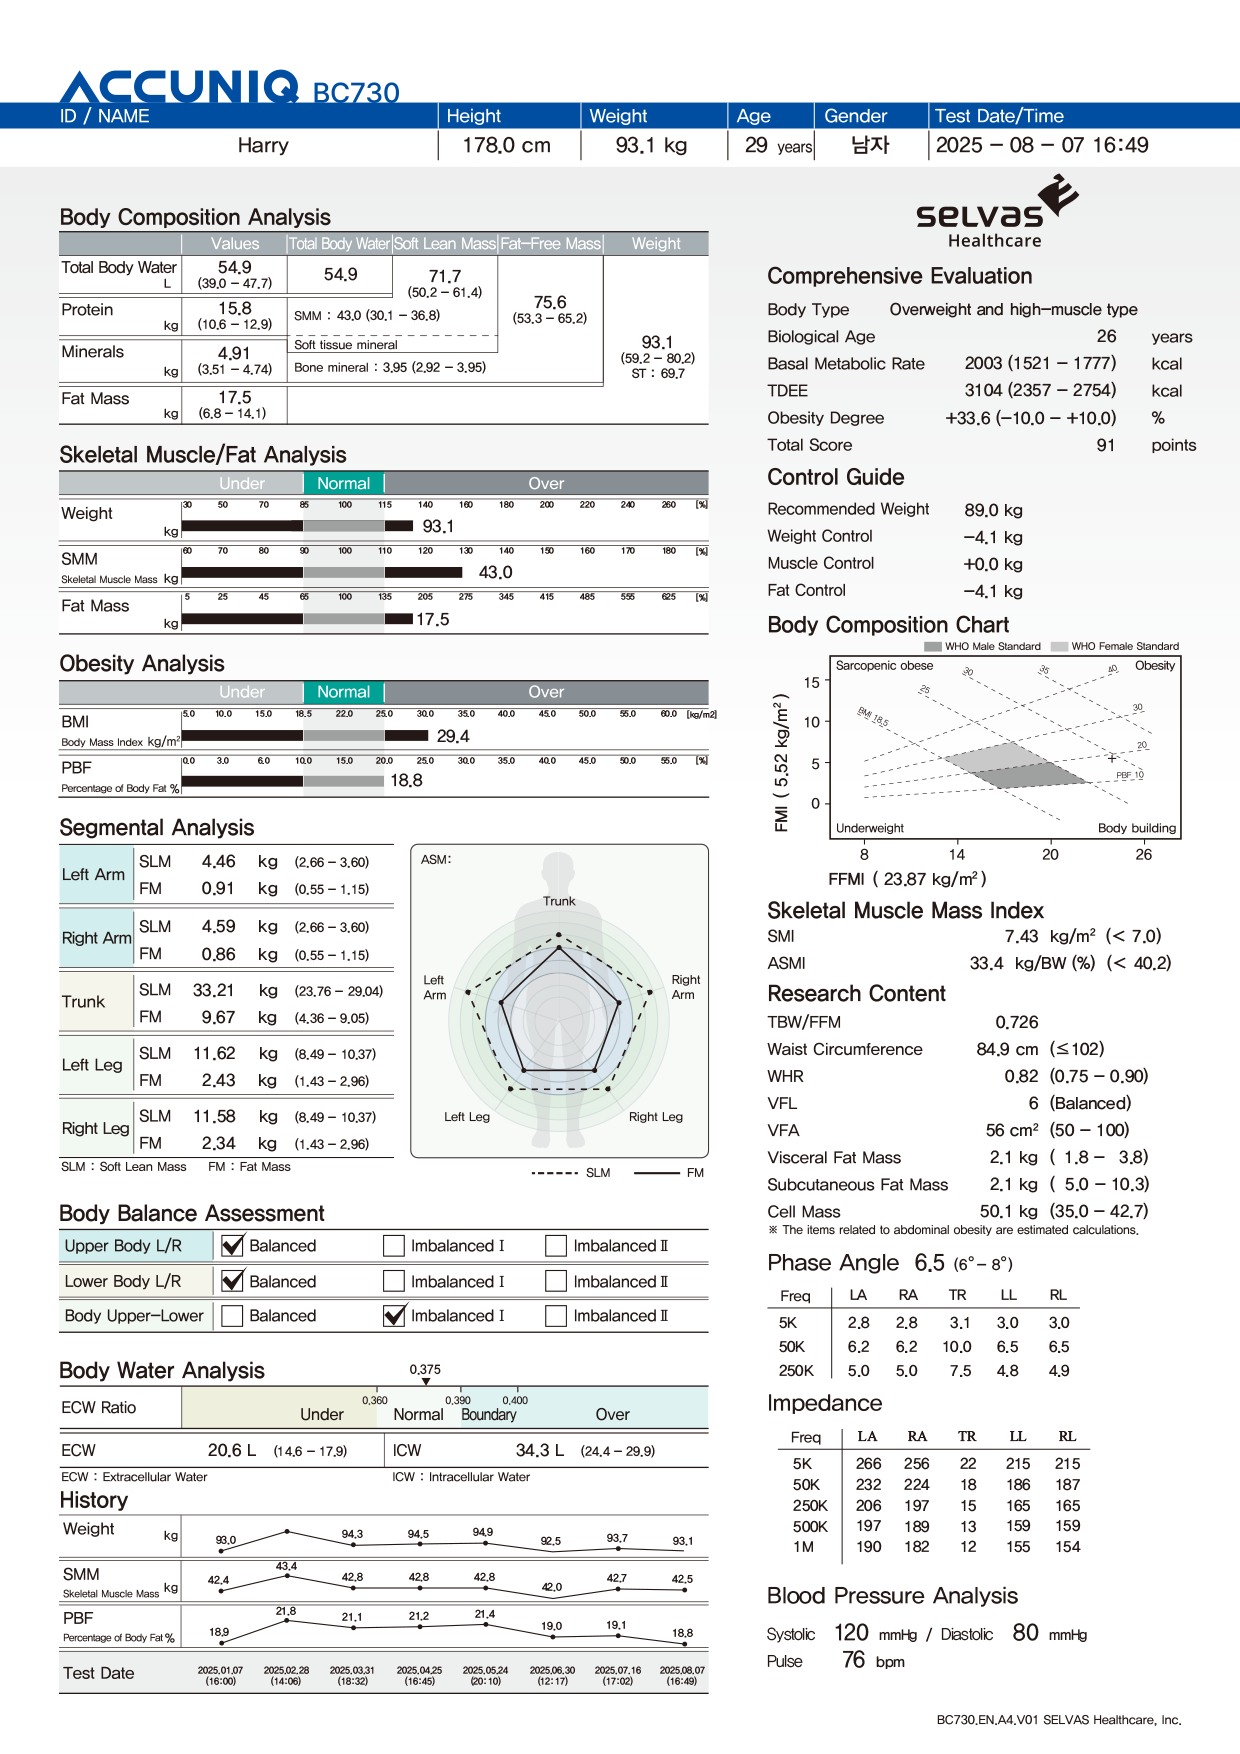
Calculates the ECW Ratio (Extracellular Water / Total Body Water) to evaluate fluid balance. A standard ratio typically maintains extracellular water at approximately one-third of total body water.
-
2
Segmental Body Water Analysis
The body water levels and status of the subject by body part (arms, legs, torso) are displayed in a graph categorized as Below Standard, Standard, or Above Standard. On the graph, the standard value is 100%; the standard range for the arms is 85–115%, and the standard range for the torso and legs is 90–110%.
-
3
Segmental ECW Ratio
The water balance status of the subject by body region (arms, legs, torso) is displayed in a graph categorized as Below Standard, Standard, Borderline, and Above Standard. The standard range for extracellular water distribution by body part is 0.360 or higher to 0.390 or lower; values exceeding 0.390 but not exceeding 0.400 are classified as borderline, and values exceeding 0.400 are classified as above standard.
-
4
Segmental Muscle Analysis
This graph displays the muscle mass of the subject by body region (arms, legs, torso) based on both standard body weight and current body weight, categorized as below standard, standard, or above standard. Muscle mass based on standard body weight is shown in black, while muscle mass (%) based on current body weight is shown in gray.
-
5
History
Cumulative data is presented in a graph to allow for a quick overview of the subject’s body composition changes, showing trends in body water, extracellular fluid, and phase angle. Data is displayed for 8 sessions; for subsequent measurements, data is deleted starting with the oldest entries.
-
6
Body Type Assessment
Based on the subject’s weight, skeletal muscle mass, and body fat mass, the system determines the subject’s current body type from among 27 classifications. First, the subject’s type is indicated in parentheses (e.g., Underweight–Normal–Overweight), and the specific body type is represented by a square icon.
-
7
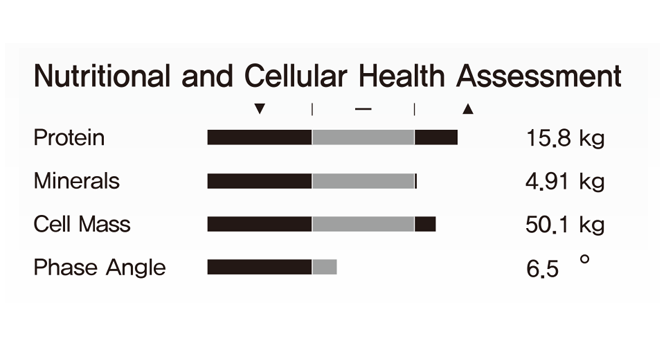
Nutrition and Cellular Health Assessment
Nutritional status is evaluated based on protein and mineral levels, which are key nutrients for immune and regulatory functions, while cellular health is assessed using cell count and phase angle.
-
8
Intracellular Water by Body Region
Provides the values and standard ranges for intracellular water levels by body region (arms, legs, torso). Intracellular water is a metric directly linked to muscle mass and cellular health. As such, it can be used as a reference for assessing body composition status by region.
-
9
Extracellular Water by Body Region
Provides values and standard ranges for extracellular water by body region (arms, legs, torso). When extracellular water accounts for one-third of total body water, body hydration is considered balanced. Therefore, by analyzing the distribution of extracellular water, one can indirectly infer conditions such as circulatory disorders or edema if the values fall outside the standard range.
-
10
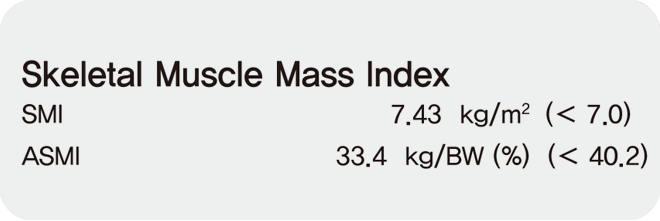
Skeletal Muscle Mass Index
Sarcopenia refers to a decrease in muscle mass and muscle strength resulting from aging, chronic diseases, and reduced physical activity. The ACCUNIQ BC730 provides SMI (Skeletal Muscle Mass Index), an indicator for evaluating sarcopenia, as well as ASMI(Appendicular Skeletal Muscle Mass Index), which is used as a correction factor for sarcopenia, along with FFMI (Fat-Free Mass Index) and FMI (Fat Mass Index).
-
11
Phase Angle
This is an indicator of cellular health. A low phase angle indicates insufficient cellular energy storage capacity and issues with the electrical conductivity of the cell membrane, while a high phase angle signifies a high cellular mass and a healthy cell membrane.
-
12
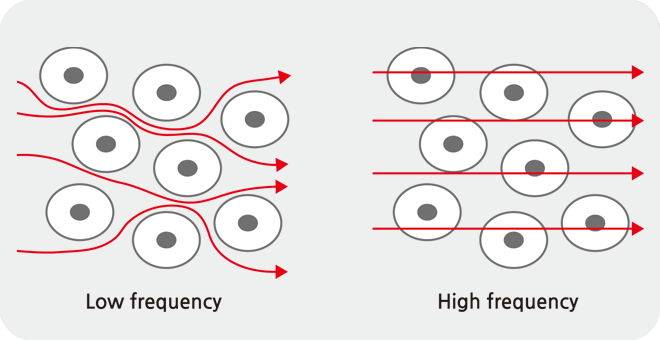
Impedance
Displays impedance by frequency and body region. Impedance is the resistance value generated when an electric current is passed through the body, and each individual has a unique value.